[A rough transcript of my keynote at the Victorians Institute Conference, held at the University of Virginia on October 1-3, 2010. The conference had the theme “By the Numbers.” Attended by “analog” Victorianists as well as some budding digital humanists, I was delighted by the incredibly energetic reaction to this talk—many terrific questions and ideas for doing scholarly text mining from those who may have never considered it before. The talk incorporates work on historical text mining under an NEH grant, as well as the first results of a grant that Fred Gibbs and I were awarded from Google to mine their vast collection of books.]
Why did the Victorians look to mathematics to achieve certainty, and how we might understand the Victorians better with the mathematical methods they bequeathed to us? I want to relate the Victorian debate about the foundations of our knowledge to a debate that we are likely to have in the coming decade, a debate about how we know the past and how we look at the written record that I suspect will be of interest to literary scholars and historians alike. It is a philosophical debate about idealism, empiricism, induction, and deduction, but also a practical discussion about the methodologies we have used for generations in the academy.
Victorians and the Search for Truth
Let me start, however, with the Heavens. This is Neptune. It was seen for the first time through a telescope in 1846.

At the time, the discovery was hailed as a feat of pure mathematics, since two mathematicians, one from France, Urbain Le Verrier, and one from England, John Couch Adams, had independently calculated Neptune’s position using mathematical formulas. There were dozens of poems written about the discovery, hailing the way these mathematicians had, like “magicians” or “prophets,” divined the Truth (often written with a capital T) about Neptune.
But in the less-triumphal aftermath of the discovery, it could also be seen as a case of the impact of cold calculation and the power of a good data set. Although pure mathematics, to be sure, were involved—the equations of geometry and gravity—the necessary inputs were countless observations of other heavenly bodies, especially precise observations of perturbations in the orbit of Uranus caused by Neptune. It was intellectual work, but intellectual work informed by a significant amount of data.
The Victorian era saw tremendous advances in both pure and applied mathematics. Both were involved in the discovery of Neptune: the pure mathematics of the ellipse and of gravitational pull; the computational modes of plugging observed coordinates into algebraic and geometrical formulas.
Although often grouped together under the banner of “mathematics,” the techniques and attitudes of pure and applied forms diverged significantly in the nineteenth century. By the end of the century, pure mathematics and its associated realm of symbolic logic had become so abstract and removed from what the general public saw as math—that is, numbers and geometric shapes—that Bertrand Russell could famously conclude in 1901 (in a Seinfeldian moment) that mathematics was a science about nothing. It was a set of signs and operations completely divorced from the real world.
Meanwhile, the early calculating machines that would lead to modern computers were proliferating, prodded by the rise of modern bureaucracy and capitalism. Modern statistics arrived, with its very unpure notions of good-enough averages and confidence levels.
The Victorians thus experienced the very modern tension between pure and applied knowledge, art and craft. They were incredibly self-reflective about the foundations of their knowledge. Victorian mathematicians were often philosophers of mathematics as much as practitioners of it. They repeatedly asked themselves: How could they know truth through mathematics? Similarly, as Meegan Kennedy has shown, in putting patient data into tabular form for the first time—thus enabling the discernment of patterns in treatment—Victorian doctors began wrestling with whether their discipline should be data-driven or should remain subject to the “genius” of the individual doctor.
Two mathematicians I studied for Equations from God used their work in mathematical logic to assail the human propensity to come to conclusions using faulty reasoning or a small number of examples, or by an appeal to interpretive genius. George Boole (1815-1864), the humble father of the logic that is at the heart of our computers, was the first professor of mathematics at Queen’s College, Cork. He had the misfortune of arriving in Cork (from Lincoln, England) on the eve of the famine and increasing sectarian conflict and nationalism.

Boole spend the rest of his life trying to find a way to rise above the conflict he saw all around him. He saw his revolutionary mathematical logic as a way to dispassionately analyze arguments and evidence. His seminal work, The Laws of Thought, is as much a work of literary criticism as it is of mathematics. In it, Boole deconstructs texts to find the truth using symbolical modes.
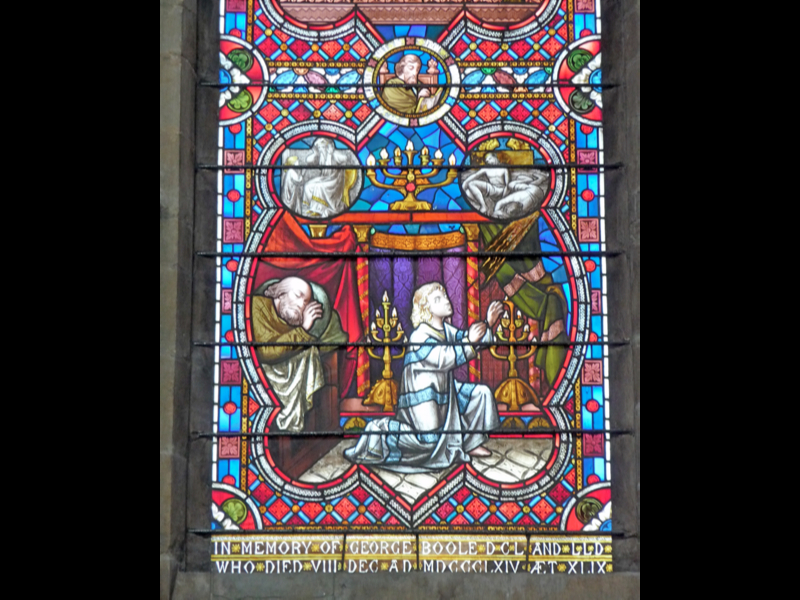
The stained-glass window in Lincoln Cathedral honoring Boole includes the biblical story of Samuel, which the mathematician enjoyed. It’s a telling expression of Boole’s worry about how we come to know Truth. Samuel hears the voice of God three times, but each time cannot definitively understand what he is hearing. In his humility, he wishes not to jump to divine conclusions.
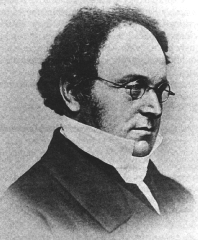
Not jumping to conclusions based on limited experience was also a strong theme in the work of Augustus De Morgan (1806-1871). De Morgan, co-discoverer of symbolic logic and the first professor of mathematics at University College London, had a similar outlook to Boole’s, but a much more abrasive personality. He rather enjoyed proving people wrong, and also loved to talk about how quickly human beings leap to opinions.
De Morgan would give this hypothetical: “Put it to the first comer, what he thinks on the question whether there be volcanoes on the unseen side of the moon larger than those on our side. The odds are, that though he has never thought of the question, he has a pretty stiff opinion in three seconds.” Human nature, De Morgan thought, was too inclined to make mountains out of molehills, conclusions from scant or no evidence. He put everyone on notice that their deeply held opinions or interpretations were subject to verification by the power of logic and mathematics.
As Walter Houghton highlighted in his reading of the Victorian canon, The Victorian Frame of Mind, 1830-1870, the Victorians were truth-seekers and skeptics. They asked how they could know better, and challenged their own assumptions.
Foundations of Our Own Knowledge
This attitude seems healthy to me as we present-day scholars add digital methods of research to our purely analog ones. Many humanities scholars have been satisfied, perhaps unconsciously, with the use of a limited number of cases or examples to prove a thesis. Shouldn’t we ask, like the Victorians, what can we do to be most certain about a theory or interpretation? If we use intuition based on close reading, for instance, is that enough?
Should we be worrying that our scholarship might be anecdotally correct but comprehensively wrong? Is 1 or 10 or 100 or 1000 books an adequate sample to know the Victorians? What we might do with all of Victorian literature—not a sample, or a few canonical texts, as in Houghton’s work, but all of it.
These questions were foremost in my mind as Fred Gibbs and I began work on our Google digital humanities grant that is attempting to apply text mining to our understanding of the Victorian age. If Boole and De Morgan were here today, how acceptable would our normal modes of literary and historical interpretation be to them?
As Victorianists, we are rapidly approaching the time when we have access—including, perhaps, computational access—to the full texts not of thousands of Victorian books, or hundreds of thousands, but virtually all books published in the Victorian age. Projects like Google Books, the Internet Archive’s OpenLibrary, and HathiTrust will become increasingly important to our work.
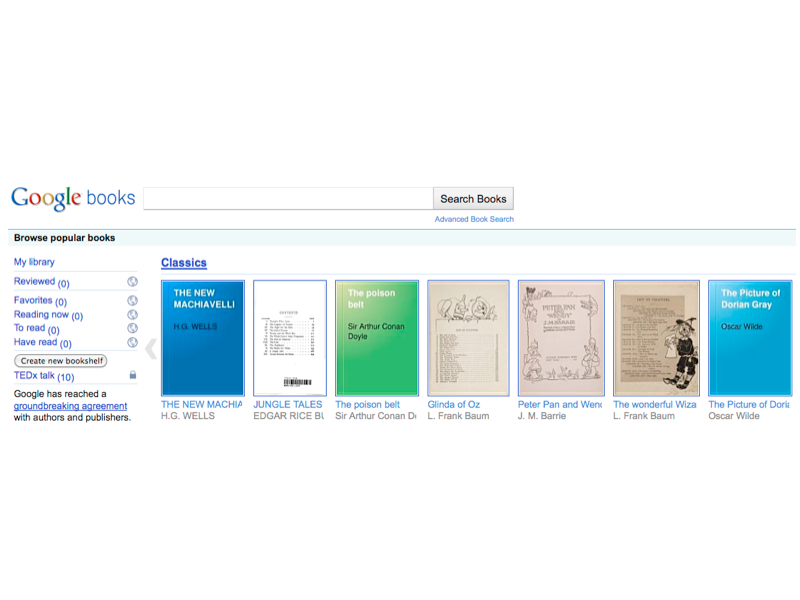

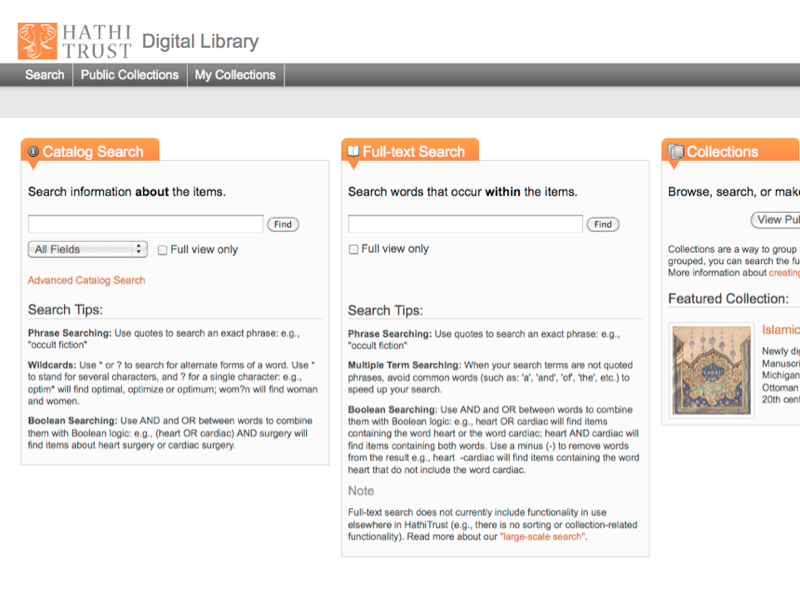
If we were to look at all of these books using the computational methods that originated in the Victorian age, what would they tell us? And would that analysis be somehow more “true” than looking at a small subset of literature, the books we all have read that have often been used as representative of the Victorian whole, or, if not entirely representative, at least indicative of some deeper Truth?
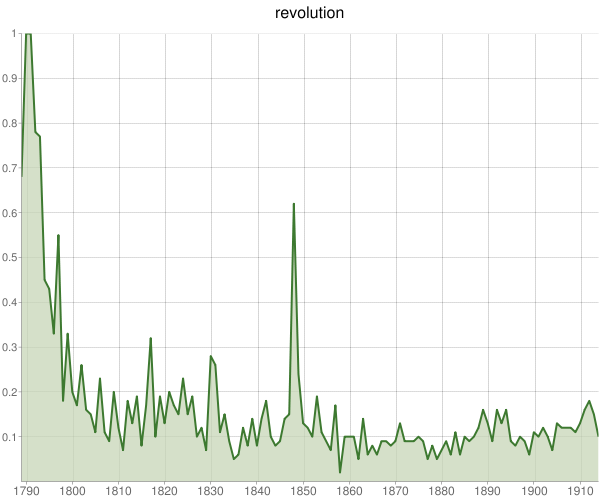
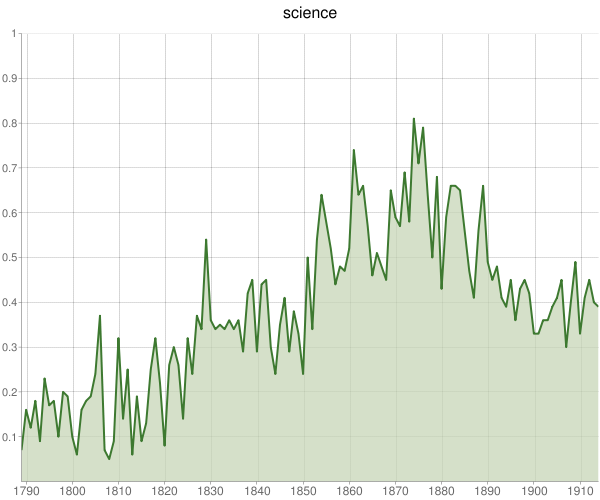
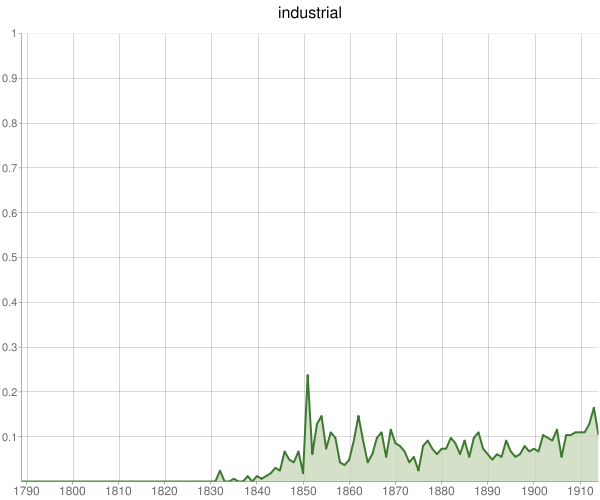
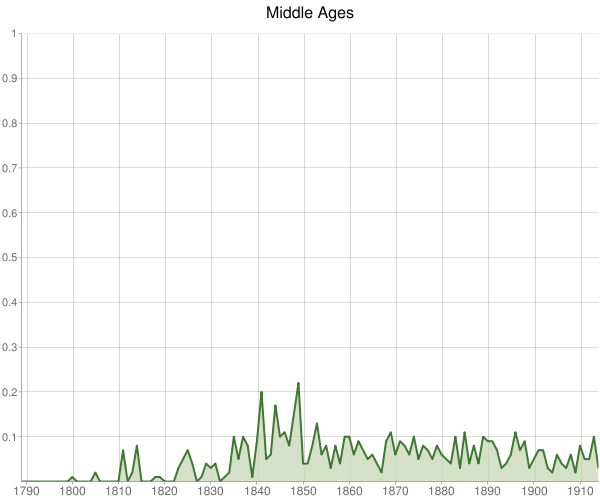
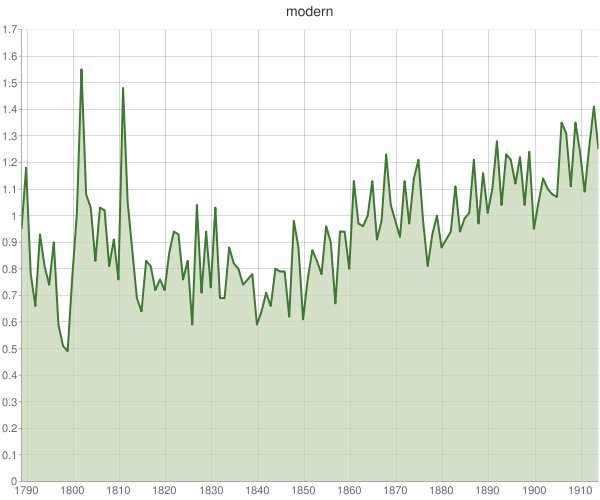
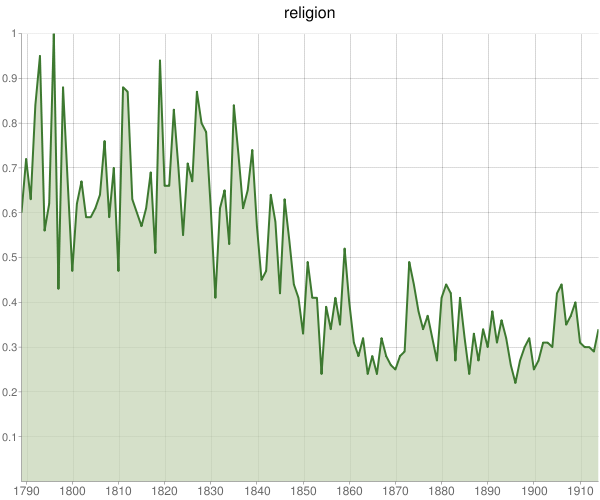
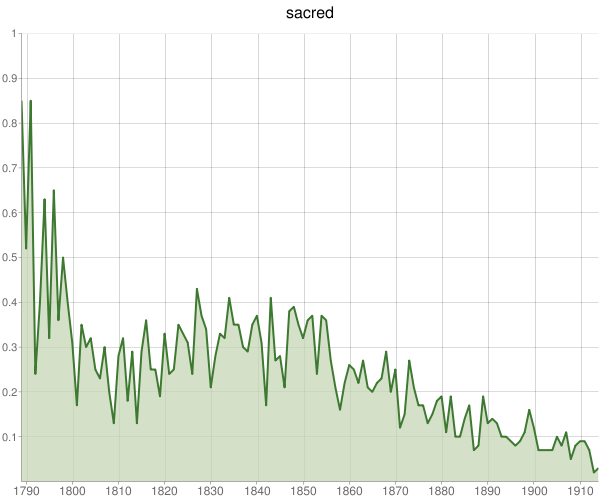
Fred and I have received back from Google a first batch of data. This first run is limited just to words in the titles of books, but even so is rather suggestive of the work that can now be done. This data covers the 1,681,161 books that were published in English in the UK in the long nineteenth century, 1789-1914. We have normalized the data in many ways, and for the most part the charts I’m about to show you graph the data from zero to one percent of all books published in a year so that they are on the same scale and can be visually compared.
Multiple printings of a book in a single year have been collapsed into one “expression.” (For the library nerds in the audience, the data has been partially FRBRized. One could argue that we should have accepted the accentuation of popular titles that went through many printings in a single year, but editions and printings in subsequent years do count as separate expressions. We did not go up to the level of “work” in the FRBR scale, which would have collapsed all expressions of a book into one data point.)
We plan to do much more; in the pipeline are analyses of the use of words in the full texts (not just titles) of those 1.7 million books, a comprehensive exploration of the use of the Bible throughout the nineteenth century, and more. And more could be be done to further normalize the data, such as accounting for the changing meaning of words over time.
Validation
So what does the data look like even at this early stage? And does it seem valid? That is where we began our analysis, with graphs of the percent of all books published with certain words in the titles (y-axis) on a year by year basis (x-axis). Victorian intellectual life as it is portrayed in this data set is in many respects consistent with what we already know.
The frequency chart of books with the word in “revolution” in the title, for example, shows spikes where it should, around the French Revolution and the revolutions of 1848. (Keen-eyed observers will also note spikes for a minor, failed revolt in England in 1817 and the successful 1830 revolution in France.)
Books about science increase as they should, though with some interesting leveling off in the late Victorian period. (We are aware that the word “science” changes over this period, becoming more associated with natural science rather than generalized knowledge.)
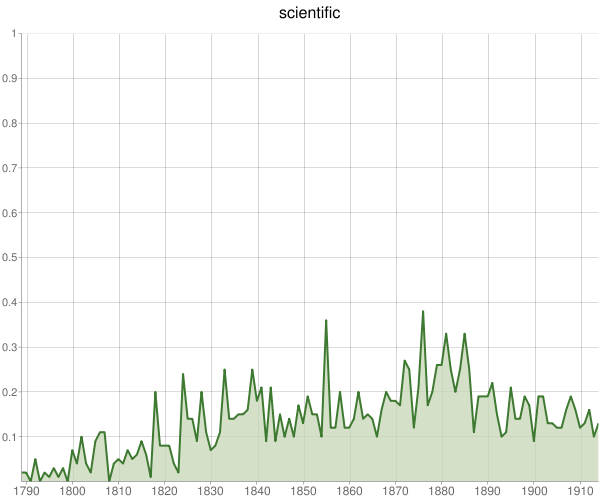
The rise of factories…
and the concurrent Victorian nostalgia for the more sedate and communal Middle Ages…
…and the sense of modernity, a new phase beyond the medieval organization of society and knowledge that many Britons still felt in the eighteenth century.
The Victorian Crisis of Faith, and Secularization
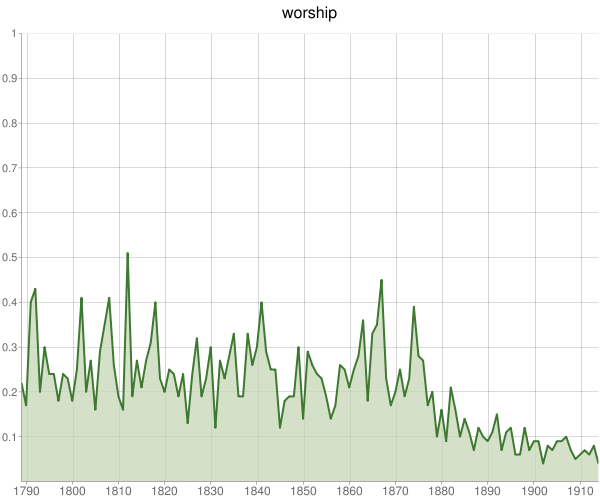
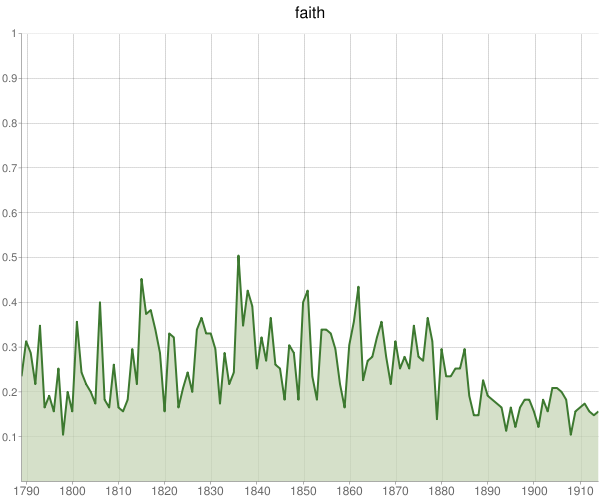
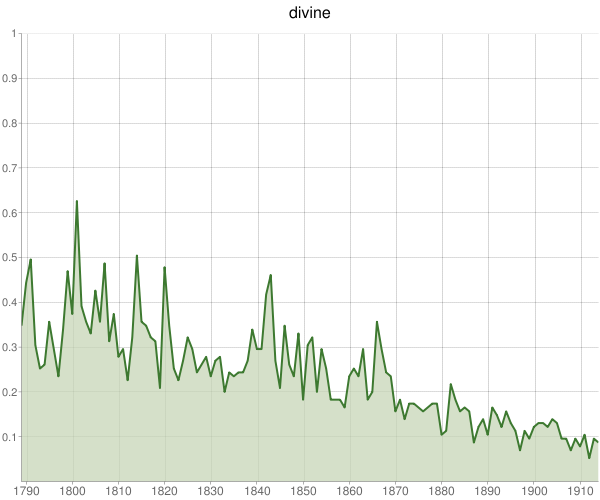
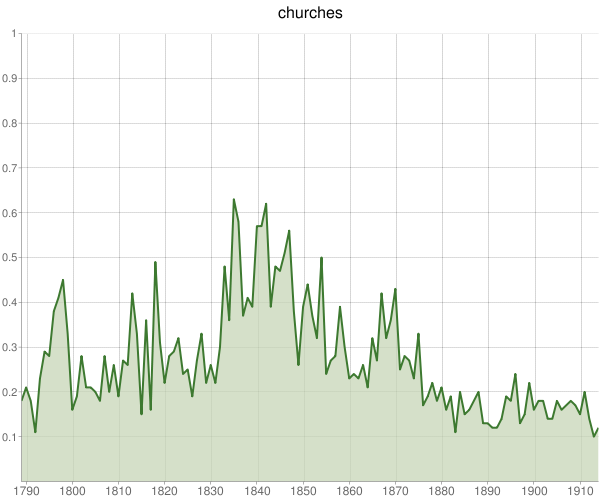
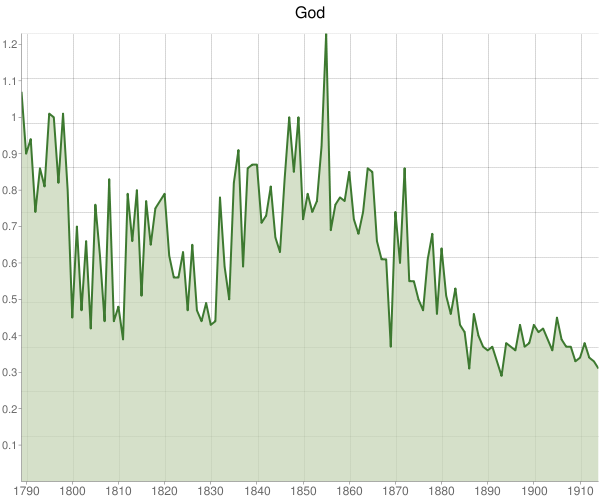
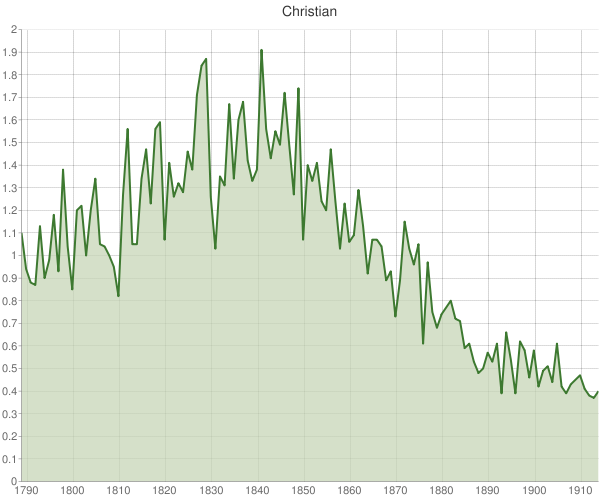
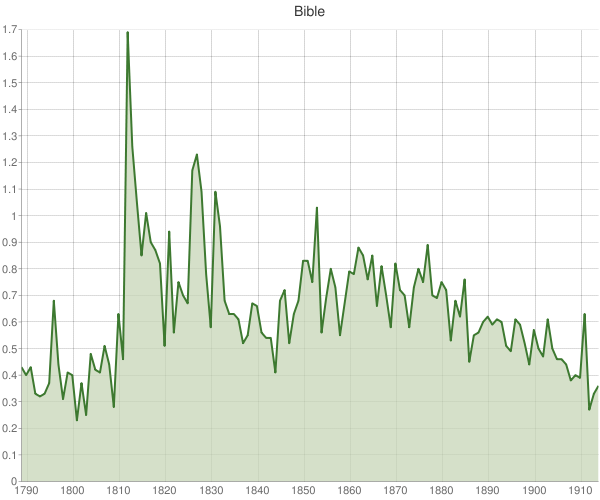
Even more validation comes from some basic checks of key Victorian themes such as the crisis of faith. These charts are as striking as any portrayal of the secularization that took place in Great Britain in the nineteenth century.
Correlation Is (not) Truth
So it looks fairly good for this methodology. Except, of course, for some obvious pitfalls. Looking at the charts of a hundred words, Fred noticed a striking correlation between the publication of books on “belief,” “atheism,” and…”Aristotle”?
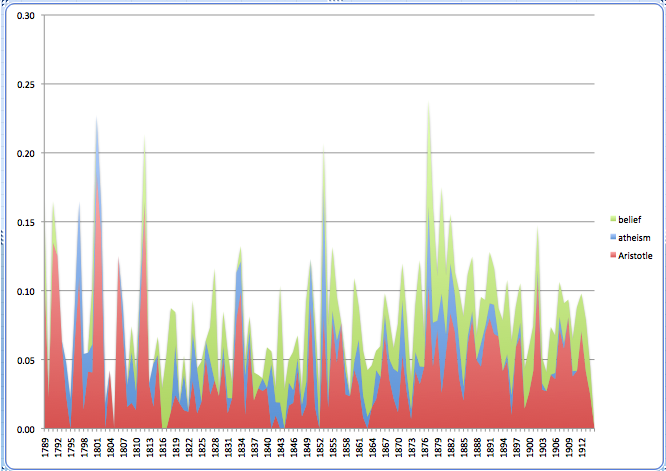
Obviously, we cannot simply take the data at face value. As I have called this on my blog, we have to be on guard for oversimplifications that are the equivalent of saying that War and Peace is about Russia. We have to marry these attempts at what Franco Moretti has called “distant reading” with more traditional close reading to find rigorous interpretations behind the overall trends.
In Search of New Interpretations
Nevertheless, even at this early stage of the Google grant, there are numerous charts that are suggestive of new research that can be done, or that expand on existing research. Correlation can, if we go from the macro level to the micro level, help us to illustrate some key features of the Victorian age better. For instance, the themes of Jeffrey von Arx’s Progress and Pessimism: Religion, Politics and History in Late Nineteenth Century Britain, in which he notes the undercurrent of depression in the second half of the century, are strongly supported and enhanced by the data.
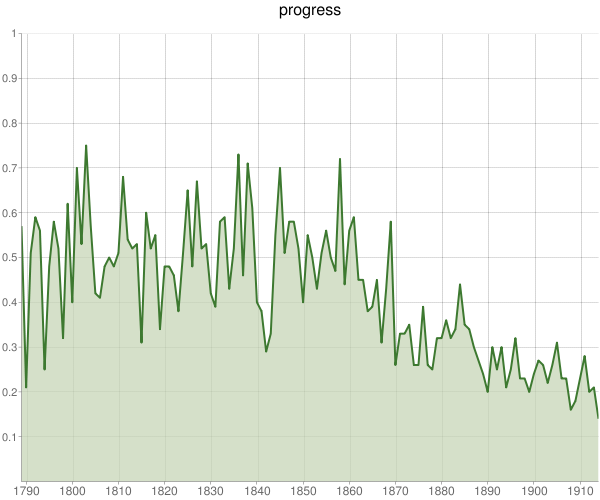
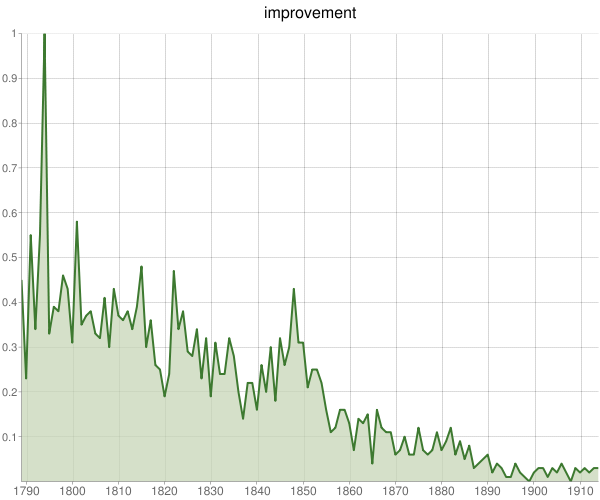
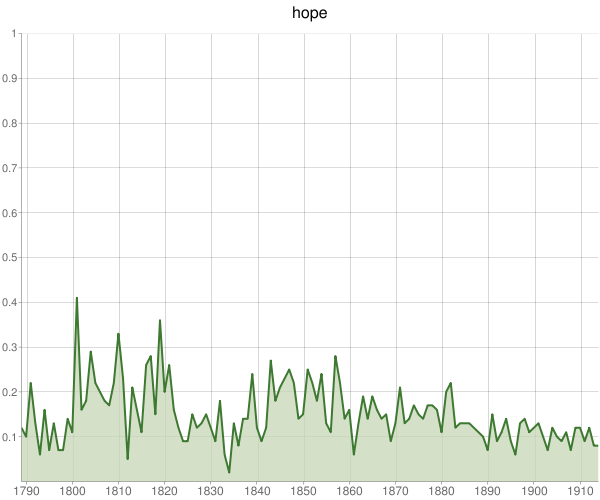
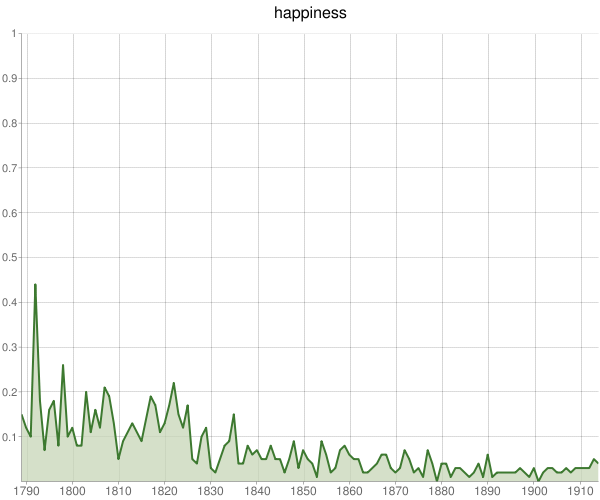
And given the following charts, we can imagine writing much more about the decline of certainty in the Victorian age. “Universal” is probably the most striking graph of our first data set, but they all show telling slides toward relativism that begin before most interpretations in the secondary literature.
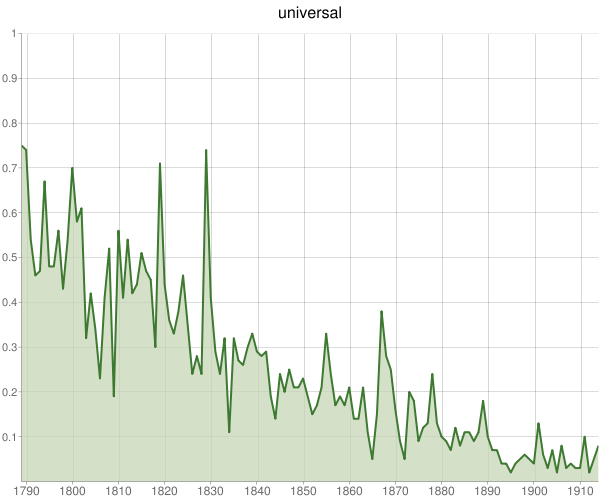
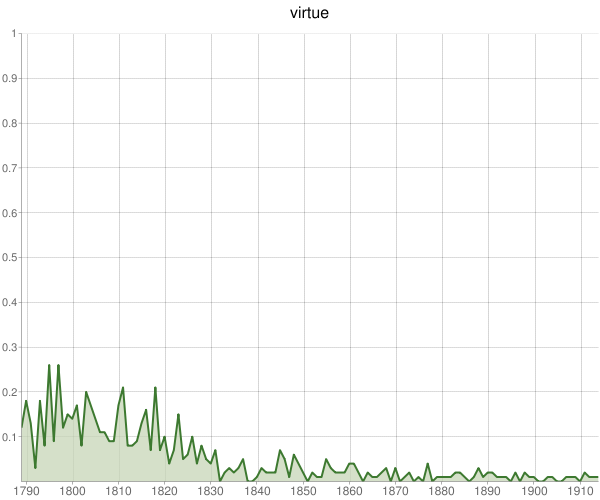
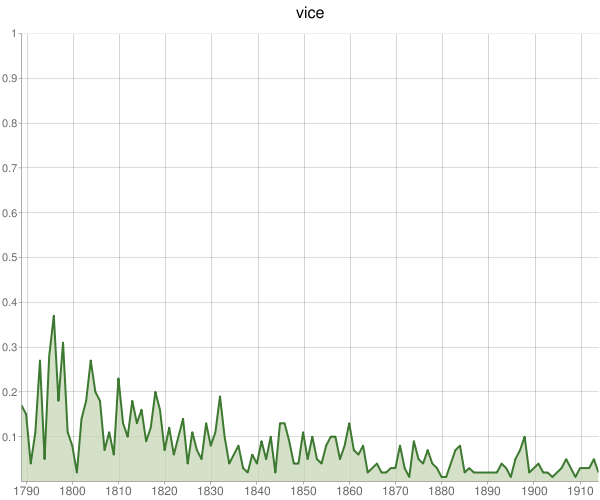
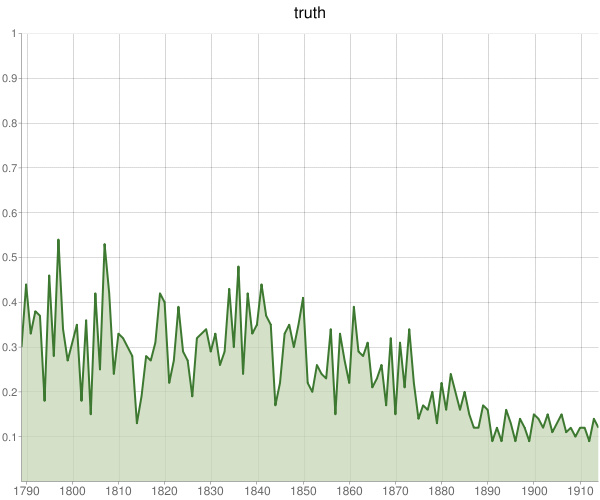
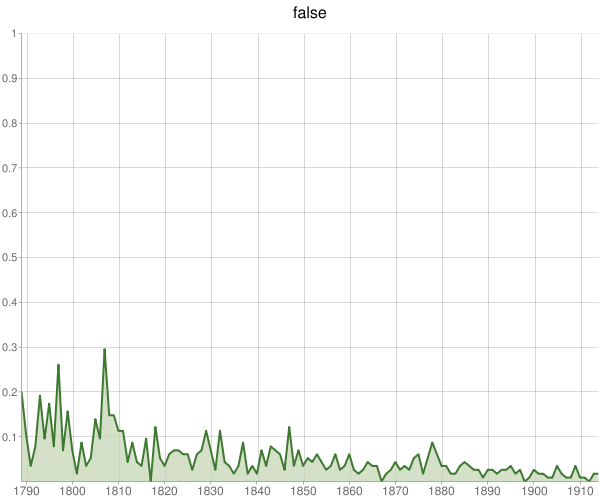
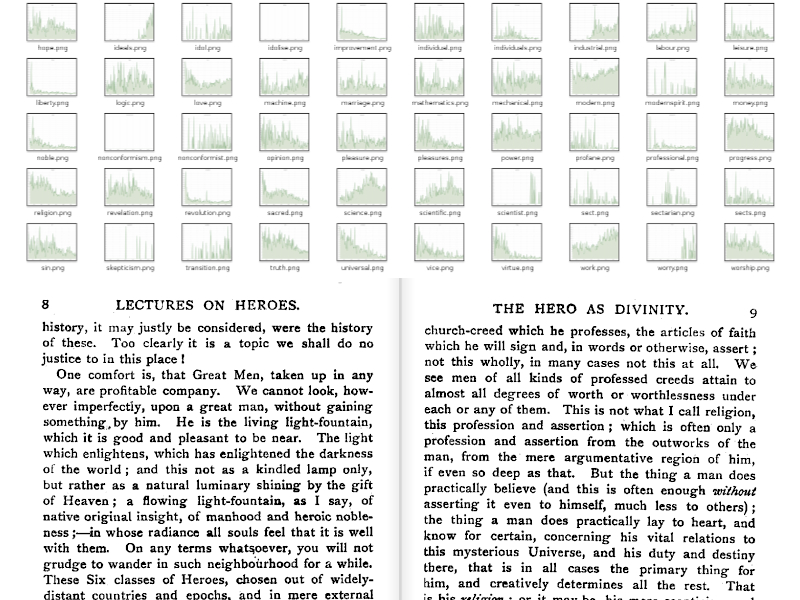
Rather than looking for what we expect to find, perhaps we can have the computer show us tens, hundreds, or even thousands of these graphs. Many will confirm what we already know, but some will be strikingly new and unexpected. Many of those may show false correlations or have other problems (such as the changing or multiple meaning of words), but some significant minority of them will reveal to us new patterns, and perhaps be the basis of new interpretations of the Victorian age.
What if I were to give you Victorianists hundreds of these charts?
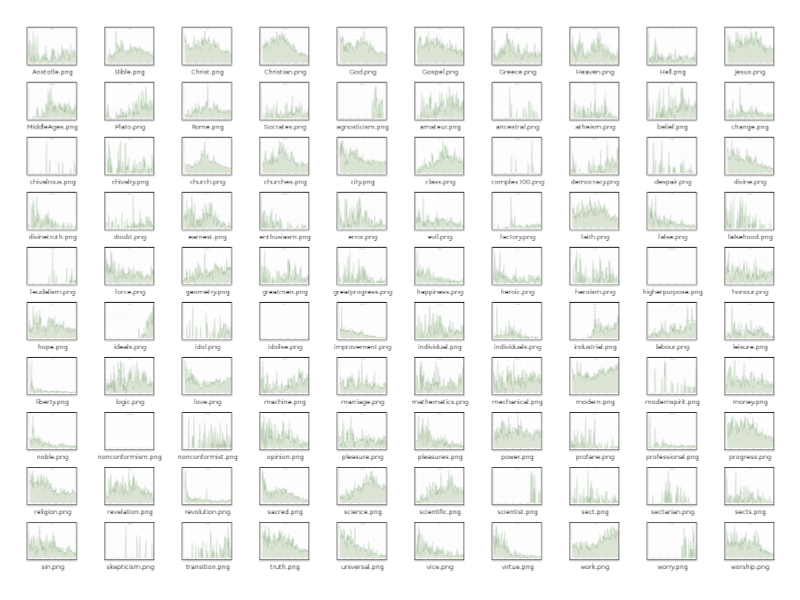
I believe it is important to keep our eyes open about the power of this technique. At the very least, it can tell us—as Augustus De Morgan would—when we have made mountains out of a molehills. If we do explore this new methodology, we might be able to find some charts that pique our curiosity as knowledgeable readers of the Victorians. We’re the ones that can accurately interpret the computational results.
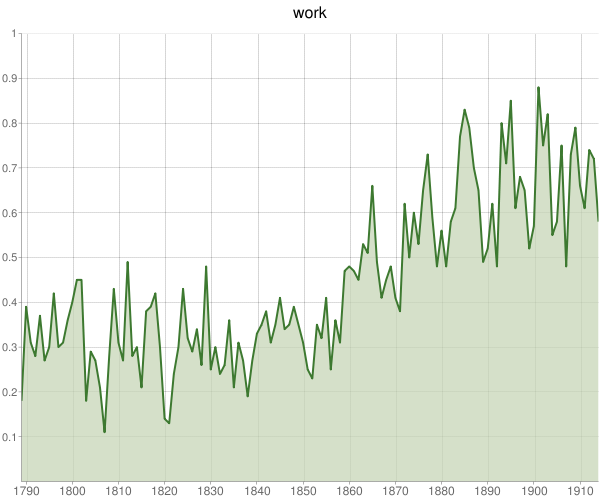
We can see the rise of the modern work lifestyle…
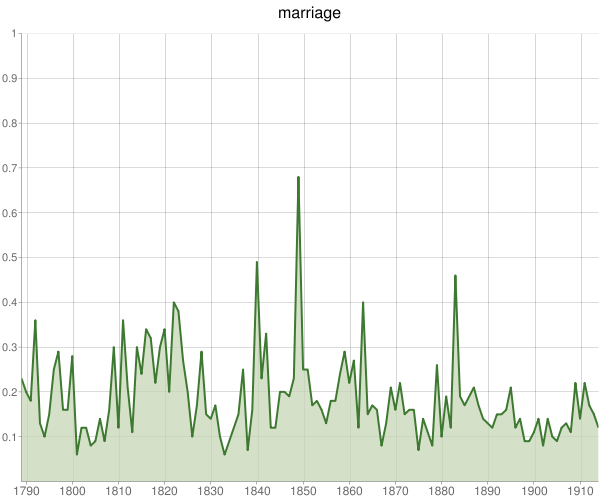
…or explore the interaction between love and marriage, an important theme in the recent literature.

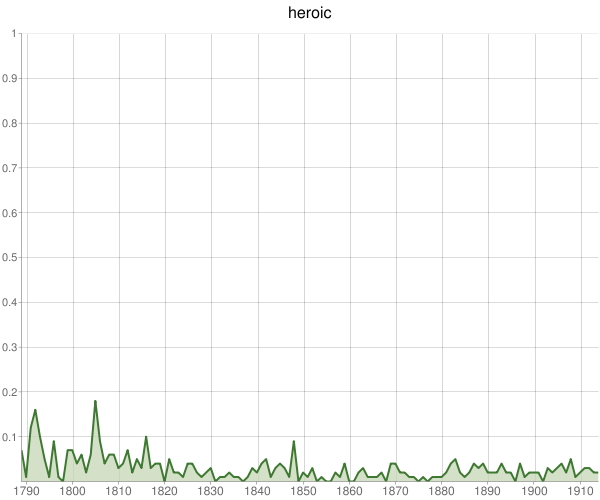
We can look back at the classics of secondary literature, such as Houghton’s Victorian Frame of Mind, and ask whether those works hold up to the larger scrutiny of virtually all Victorian books, rather than just the limited set of books those authors used. For instance, while in general our initial study supports Houghton’s interpretations, it also shows relatively few books on heroism, a theme Houghton adopts from Thomas Carlyle.
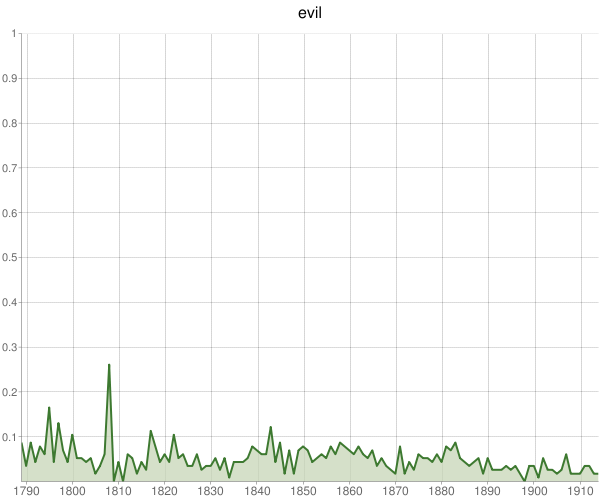
And where is the supposed Victorian obsession with theodicy in this chart on books about “evil”?
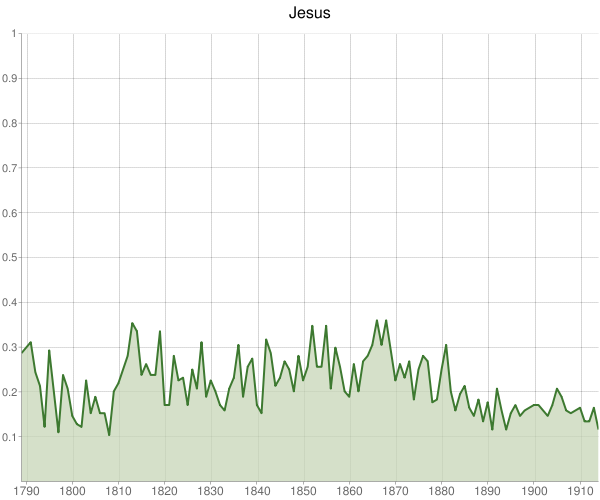
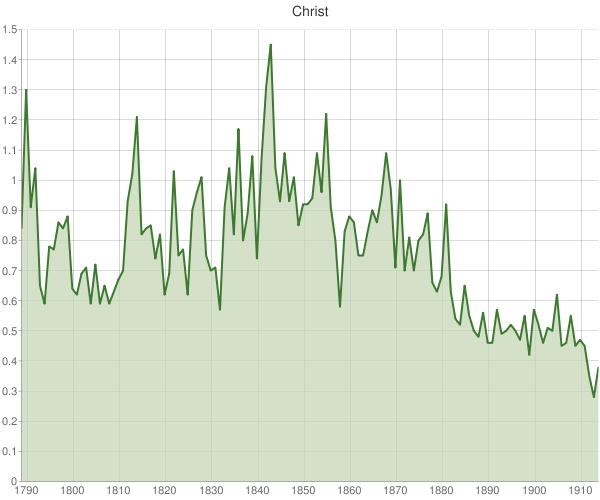
Even more suggestive are the contrasts and anomalies. For instance, publications on “Jesus” are relatively static compared to those on “Christ,” which drop from nearly 1 in 60 books in 1843 to less than 1 in 300 books 70 years later.
The impact of the ancient world on the Victorians can be contrasted (albeit with a problematic dual modern/ancient meaning for Rome)…
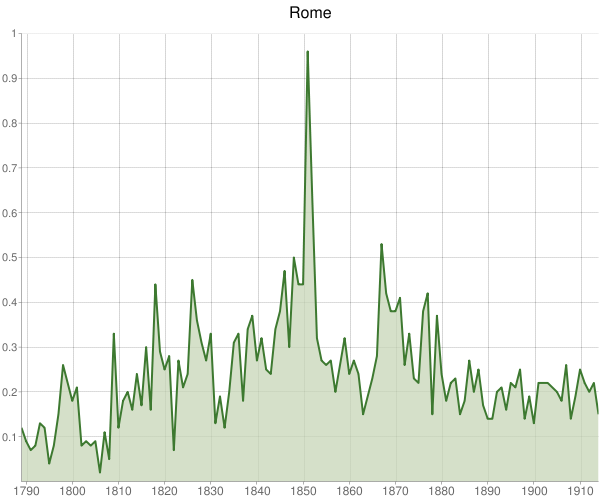
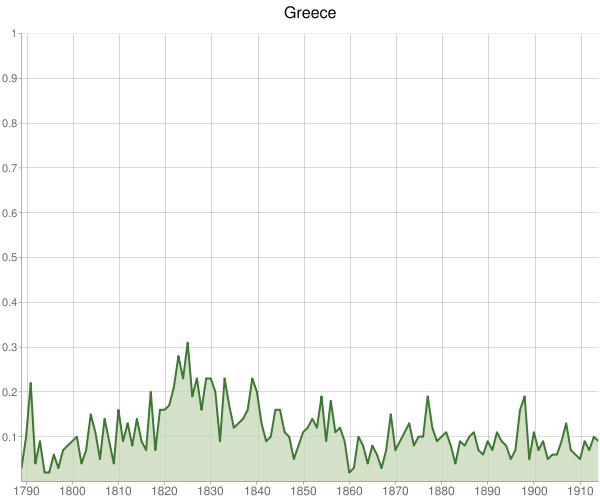
…as can the Victorians’ varying interest in the afterlife.
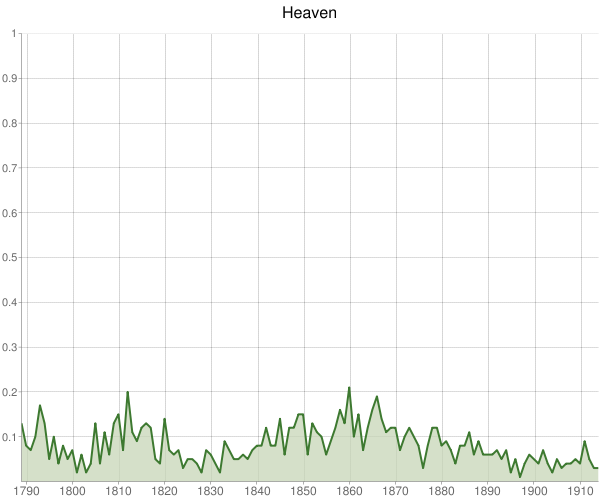
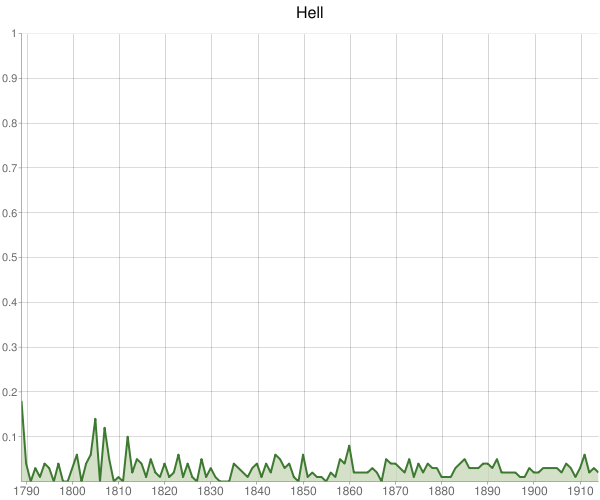
I hope that these charts have prodded you to consider the anecdotal versus the comprehensive, and the strengths and weaknesses of each. It is time we had a more serious debate—not just in the digital humanities but in the humanities more generally—about measurement and interpretation that the Victorians had. Can we be so confident in our methods of extrapolating from some literary examples to the universal whole?
This is a debate that we should have in the present, aided by our knowledge of what the Victorians struggled with in the past.
[Image credits (other than graphs): Wikimedia Commons]
Leave a Reply
You must be logged in to post a comment.